

How to debug Lightning Web Components? Join us to learn about different solution to Debug Lightning Web Components. Lightning web components are built using standard HTML and JavaScript, and on the desktop they run in a variety of supported browsers. You can use standard browser and JavaScript debugging tools, like Chrome DevTools, to debug your components during development.
Debug LWC
The simplest way to run and debug a component during development is to create a Lightning Page and add your component to it. Then load the Lightning Page in your preferred browser and use your favorite inspection and debugging tools. LWC debugging is optimized for Chrome DevTools.
1. Production Mode
By default, the framework runs in production mode. This mode is optimized for performance.
In production mode, JavaScript code is optimized and “minified” to reduce the size of the code to as few bytes as possible. Production mode removes line breaks, spaces, tabs, and code comments, and shortens the names of functions and variables.
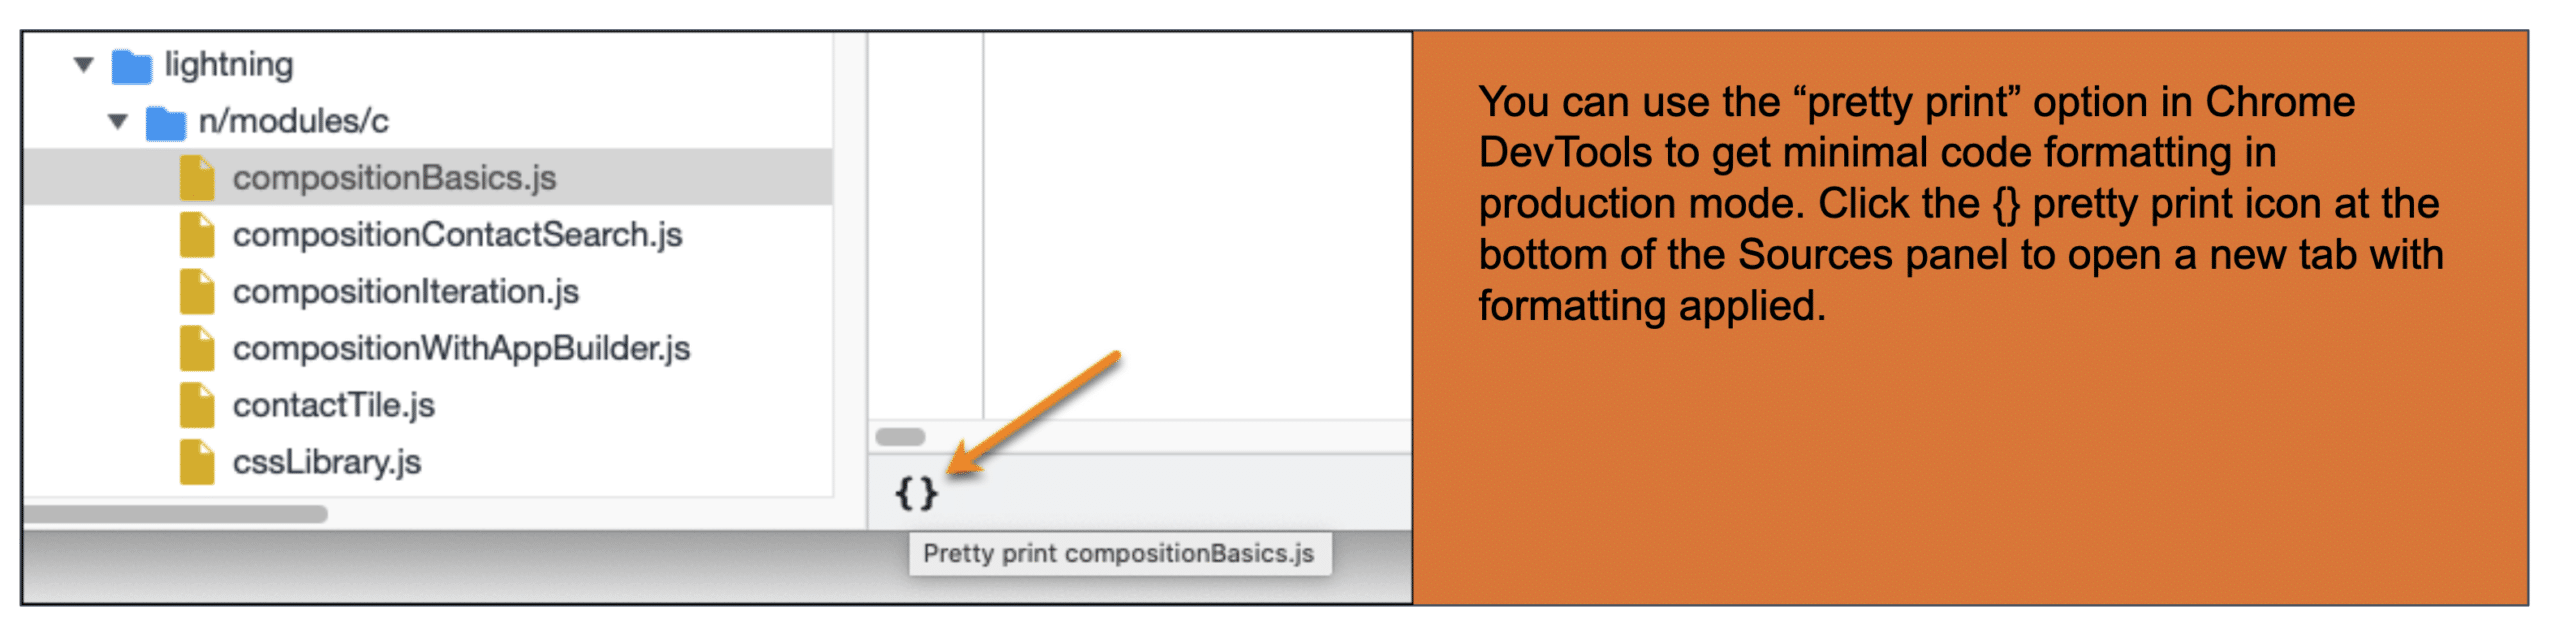
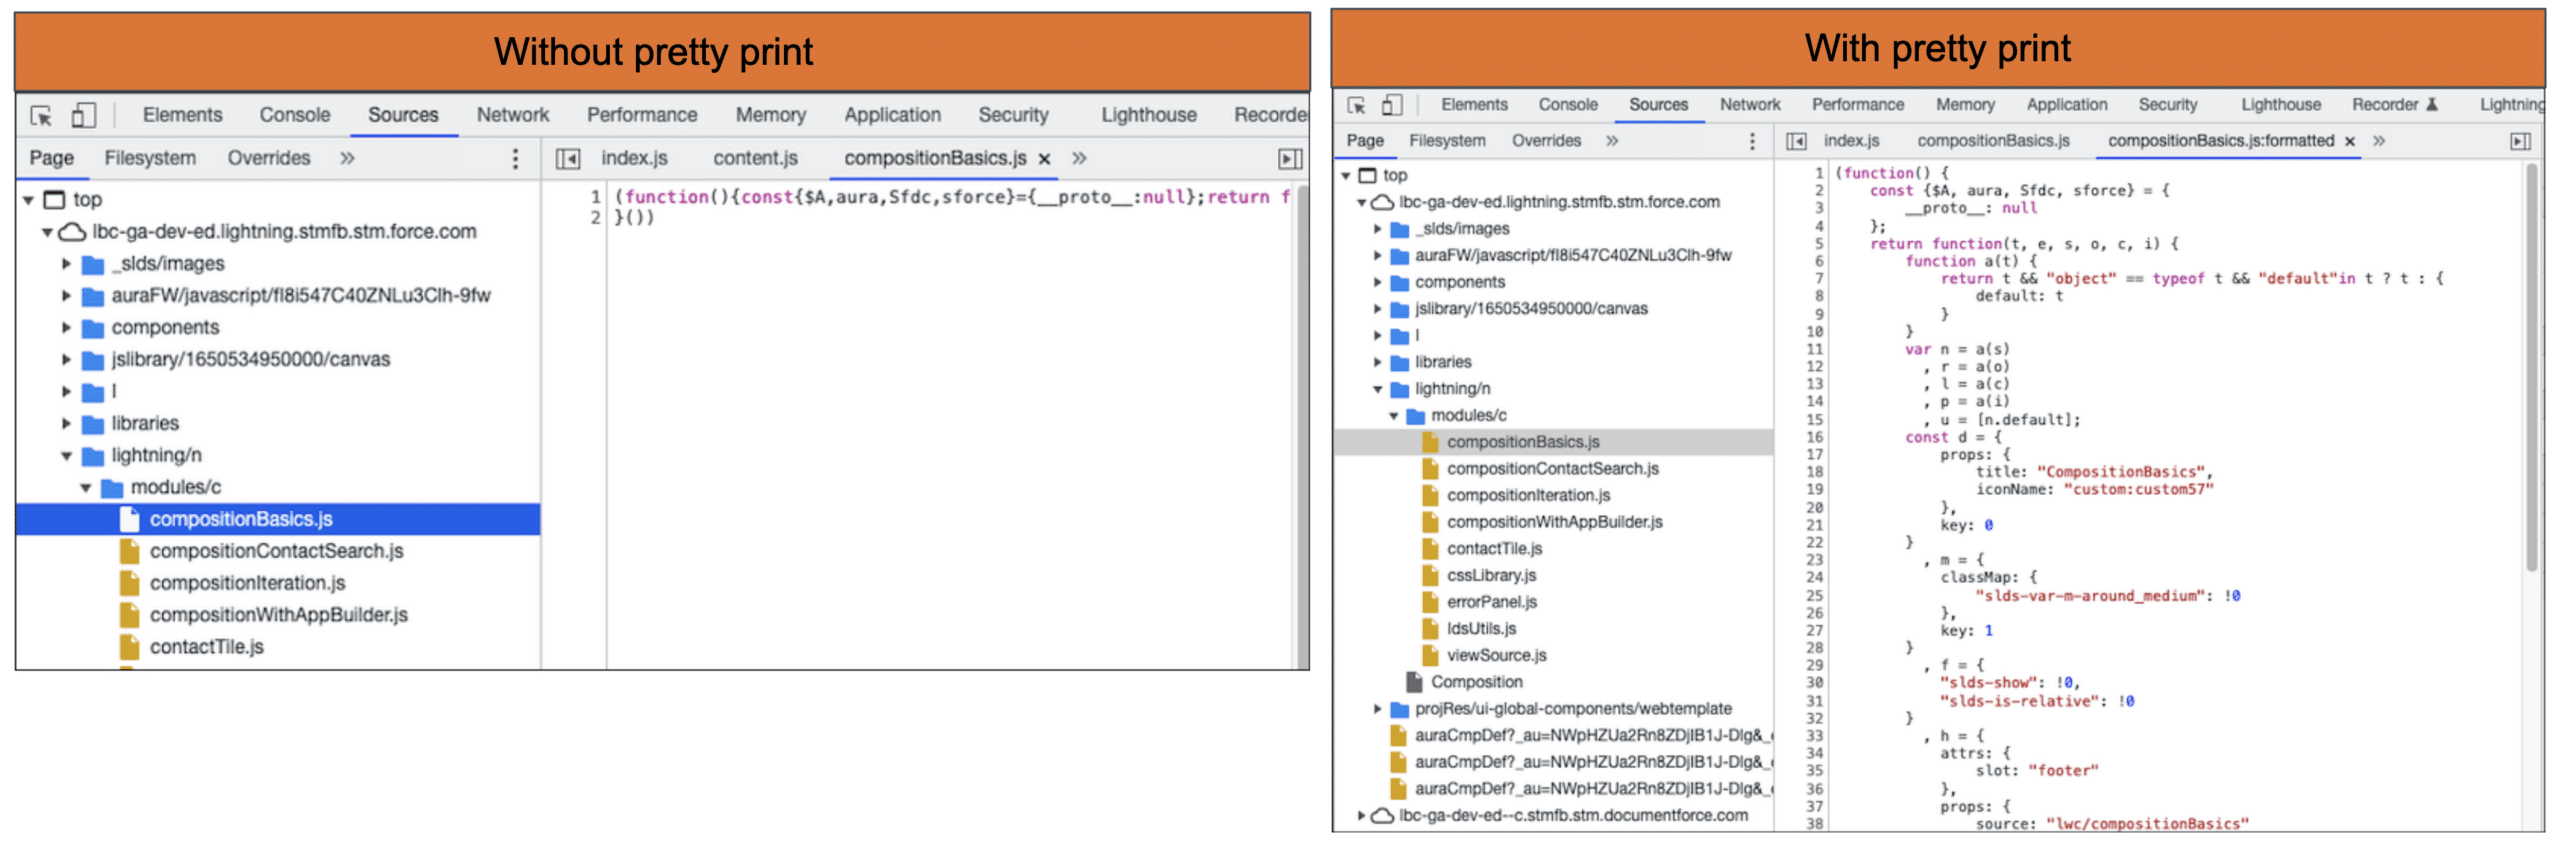
Here is a sample of what you will see in production mode without pretty print option vs with pretty print option.
2. Debug Mode
In debug mode, JavaScript code is easier to read and debug. The JavaScript source you see in DevTools looks similar to your uncompiled source code. Debug mode also adds more detailed output for some warnings and errors.
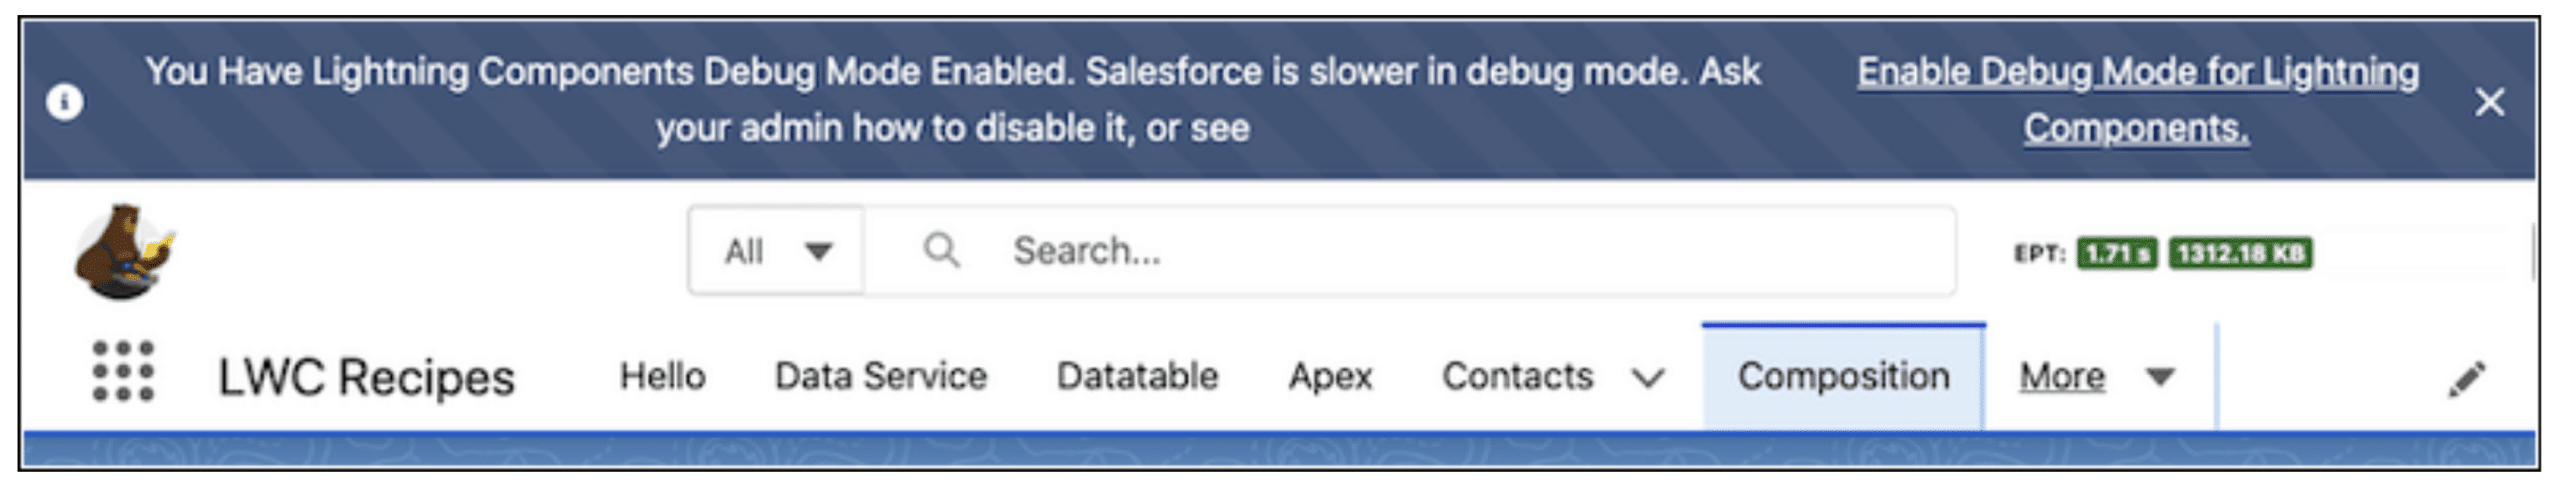
After your user account is enabled for debug mode, you see these changes.
- A banner appears at the top to remind you that debug mode is on and that it slows things down.
- An Experienced Page Time (EPT) metric appears in the page header. It’s presented in green, orange, or red to indicate the health of the page’s load time.
- A storage metric in the page header shows kilobytes of data stored by the page to indicate memory usage and caching. The metric is similarly color-coded with green, orange, or red.
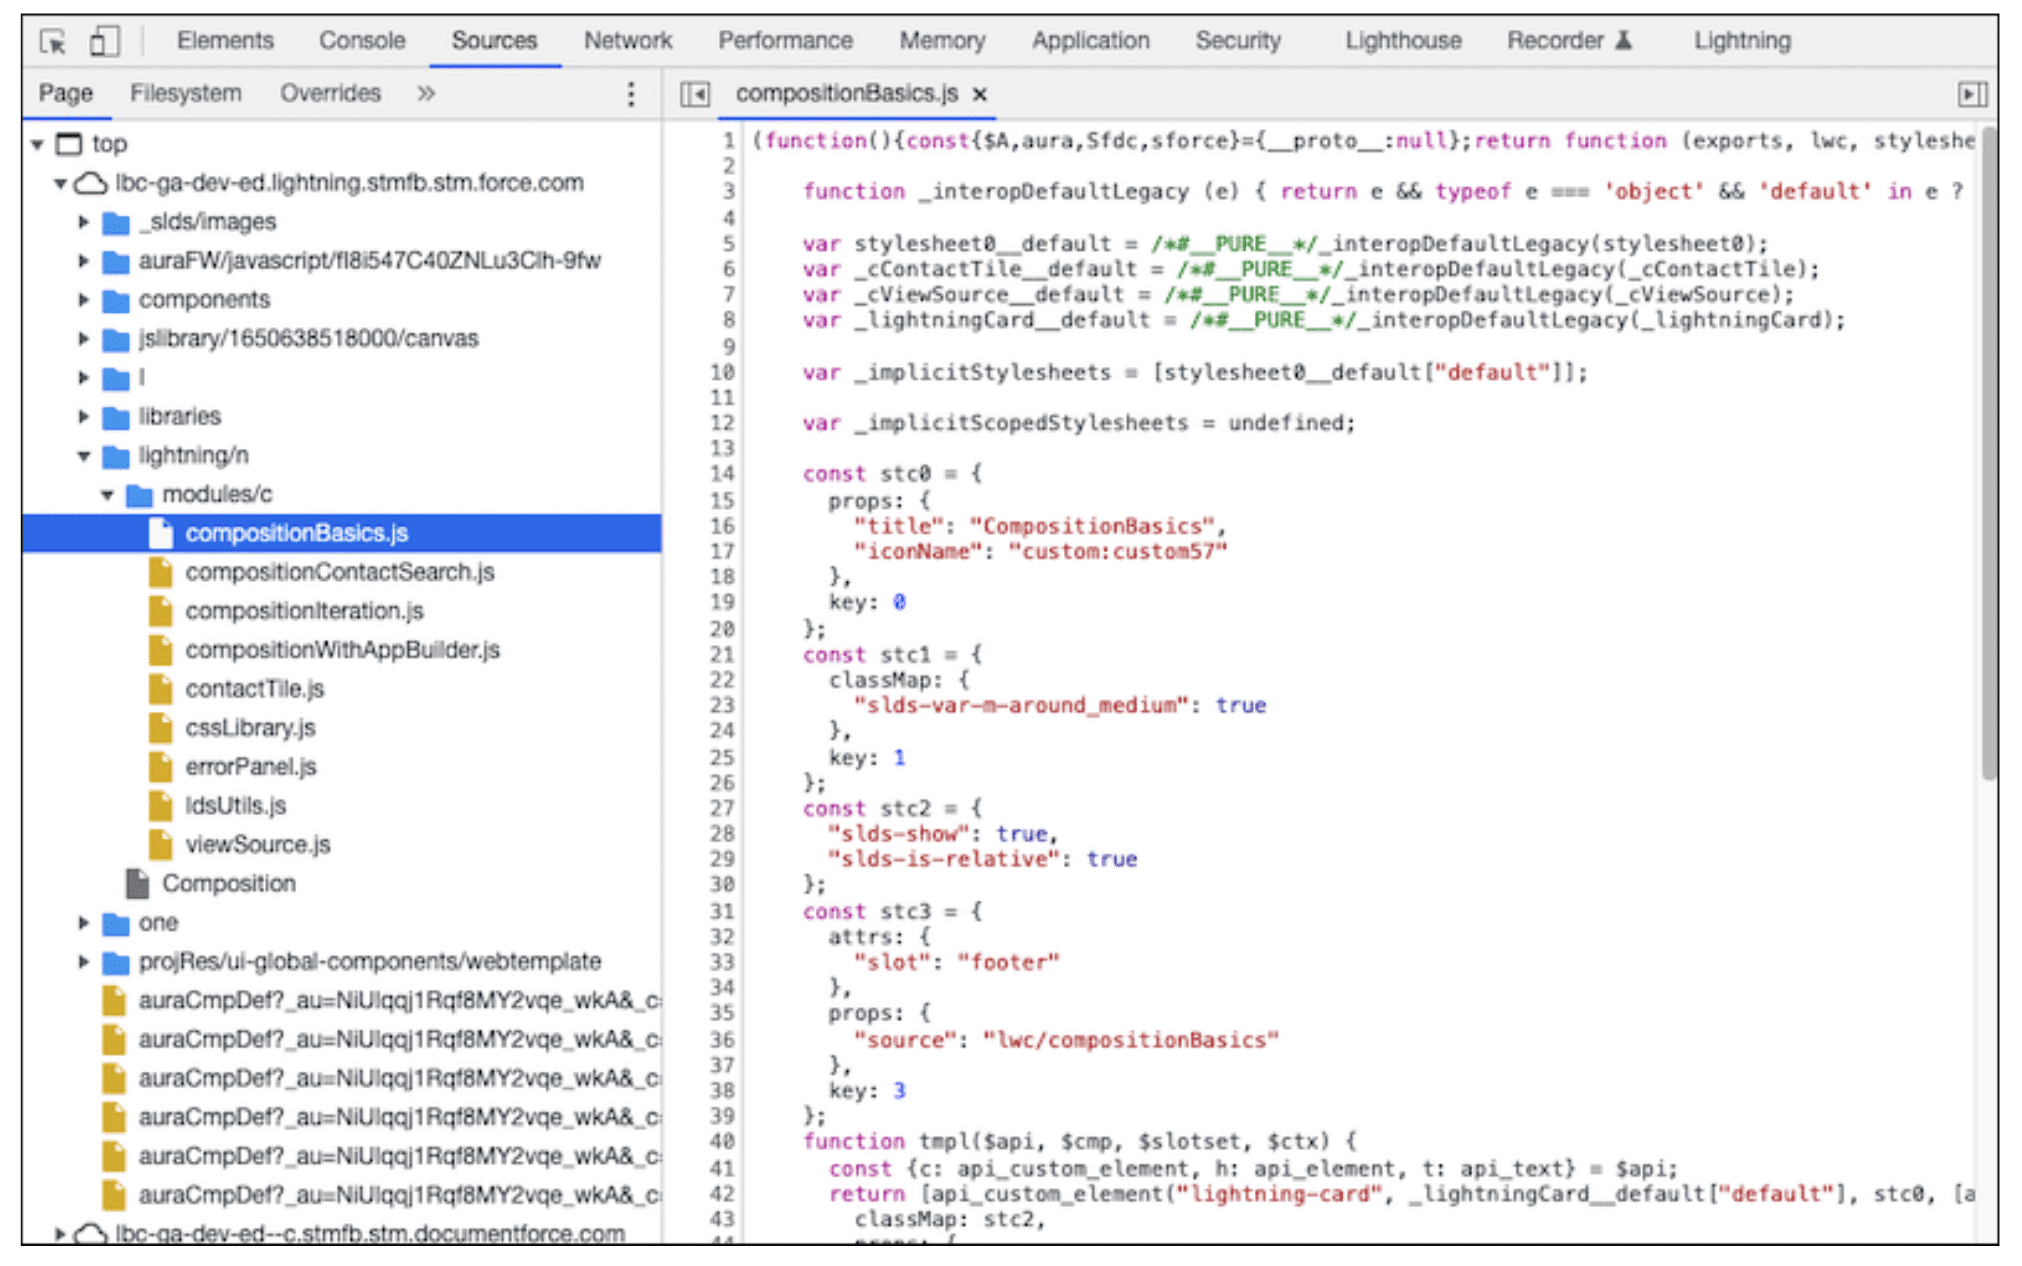
The same lwc-recipes sample code we looked at in production mode with pretty print looks less cryptic when unminified with debug mode enabled. It’s more readable and shows names of functions and variables.
Enable Debug Mode
- In Salesforce, from Setup, enter Debug Mode in the Quick Find box, then select Debug Mode Users.
- Users with debug mode enabled have a check mark in the Debug Mode column.
- In the user list, locate any users who need debug mode enabled. If necessary, use the standard list view controls to filter your org’s users.
- Select the checkbox next to users for whom you want to enable debug mode.
- Click Enable.
Tips
- If you see only a few lines of code in a JavaScript file, then debug mode is not enabled. If enabling debug mode doesn’t reset the code in the code editor, do a hard reload. With DevTools open, right-click the browser Reload button and then click Hard Reload.
- Only enable debug mode for users who are actively debugging JavaScript. Salesforce is slower for users who have debug mode enabled.
3. Use Chrome DevTools
Google Chrome includes a comprehensive suite of excellent web development tools, Chrome DevTools. These tools are great for debugging your Lightning web components.
To get started, load the simplest page possible that can run your Lightning component. Then open DevTools.
- On Windows and Linux, press Control-Shift-I in your Google Chrome browser.
- On Mac, press Option-Command-I.
- On any platform, press F12 or right-click in the page and select Inspect.
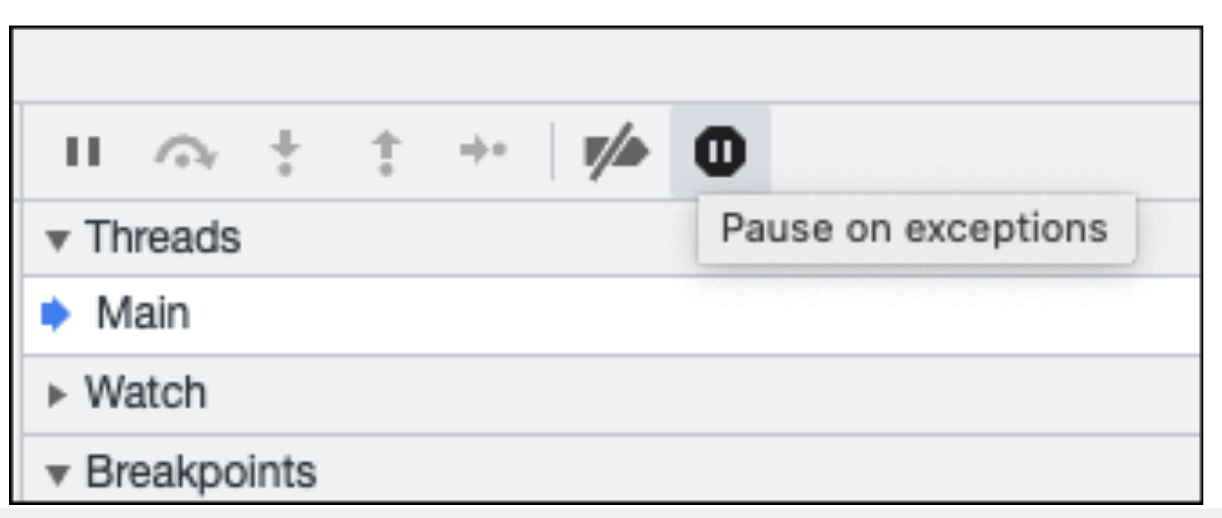
To quickly find which line of code is failing, in the Sources panel, enable the Pause on all exceptions option in the DevTools debugger panel before running your code.
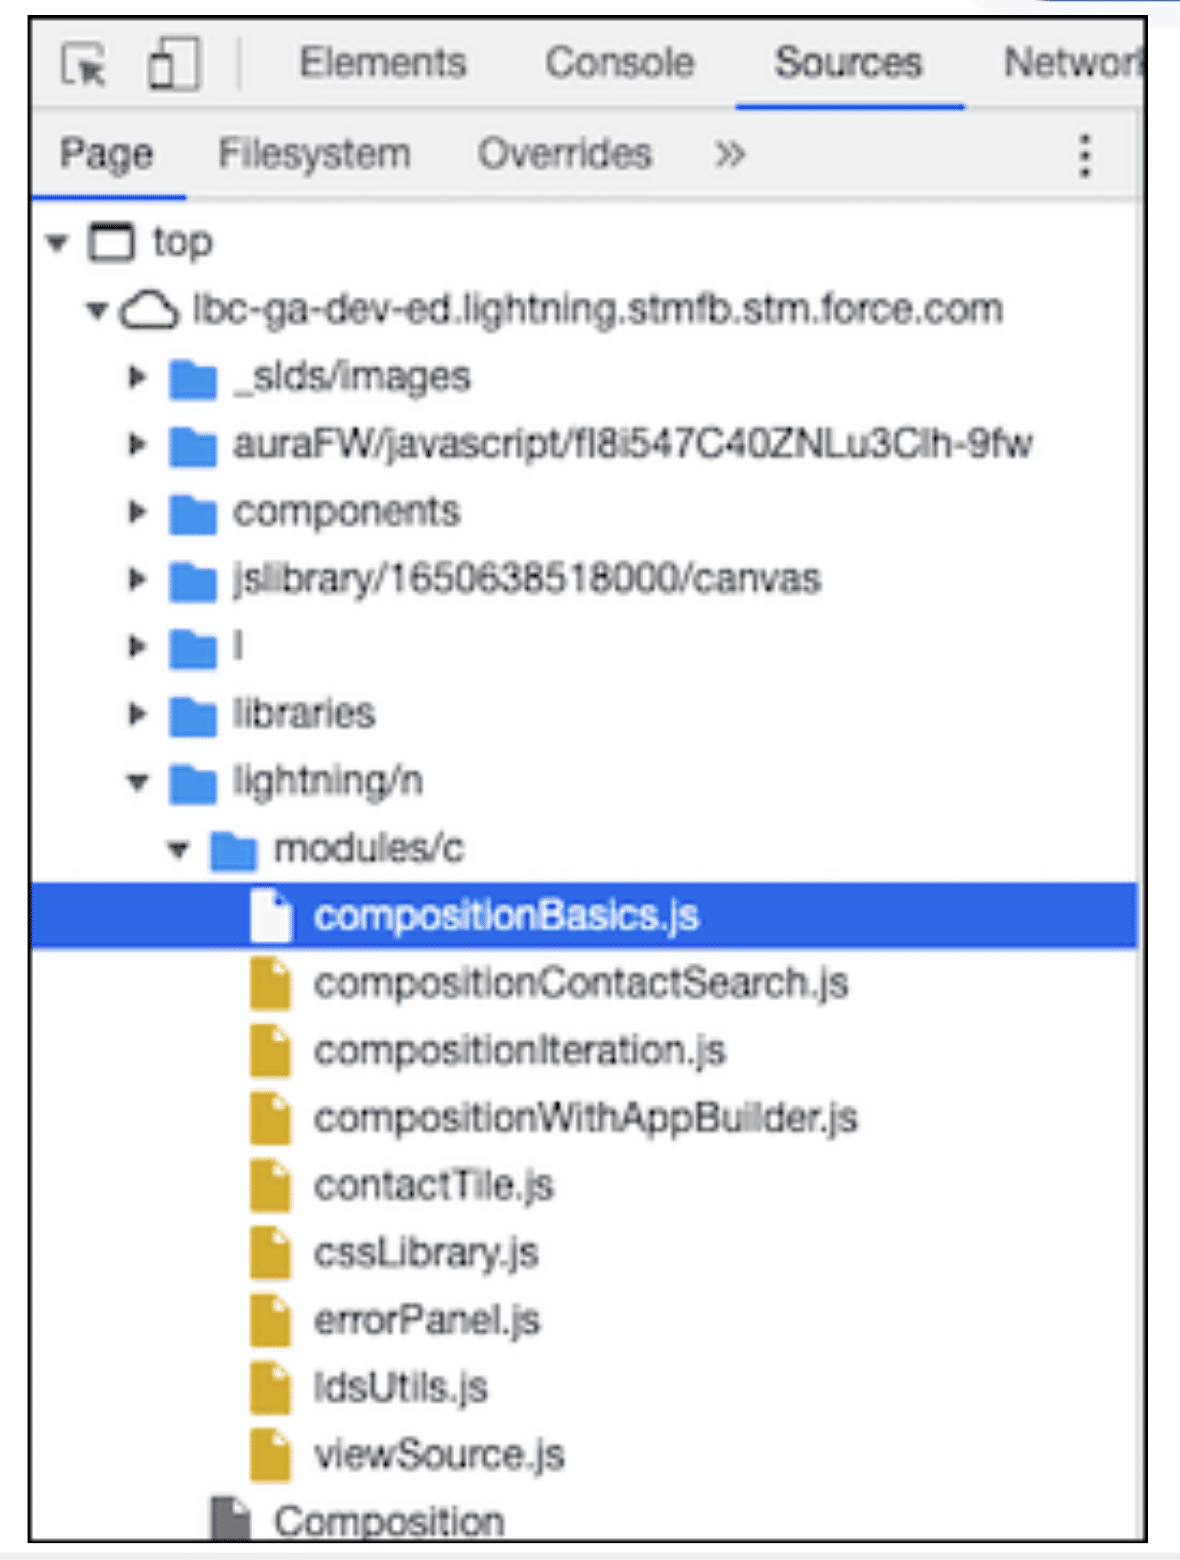
In the Sources panel of Chrome DevTools, find your Lightning web component code in the Page pane in the lightning/n/modules folder. Here you see components in the default c namespace folder.
4. Debug with LWS Enabled
Debugging techniques are the same for code compiled for LWS, but let’s walk through a few differences.
Source Code Location with LWS
As you debug Lightning web components with Chrome DevTools, your component source code is normally displayed in the Sources panel inside the lightning/n folder, as described in Find Your Code in the Sources Panel.
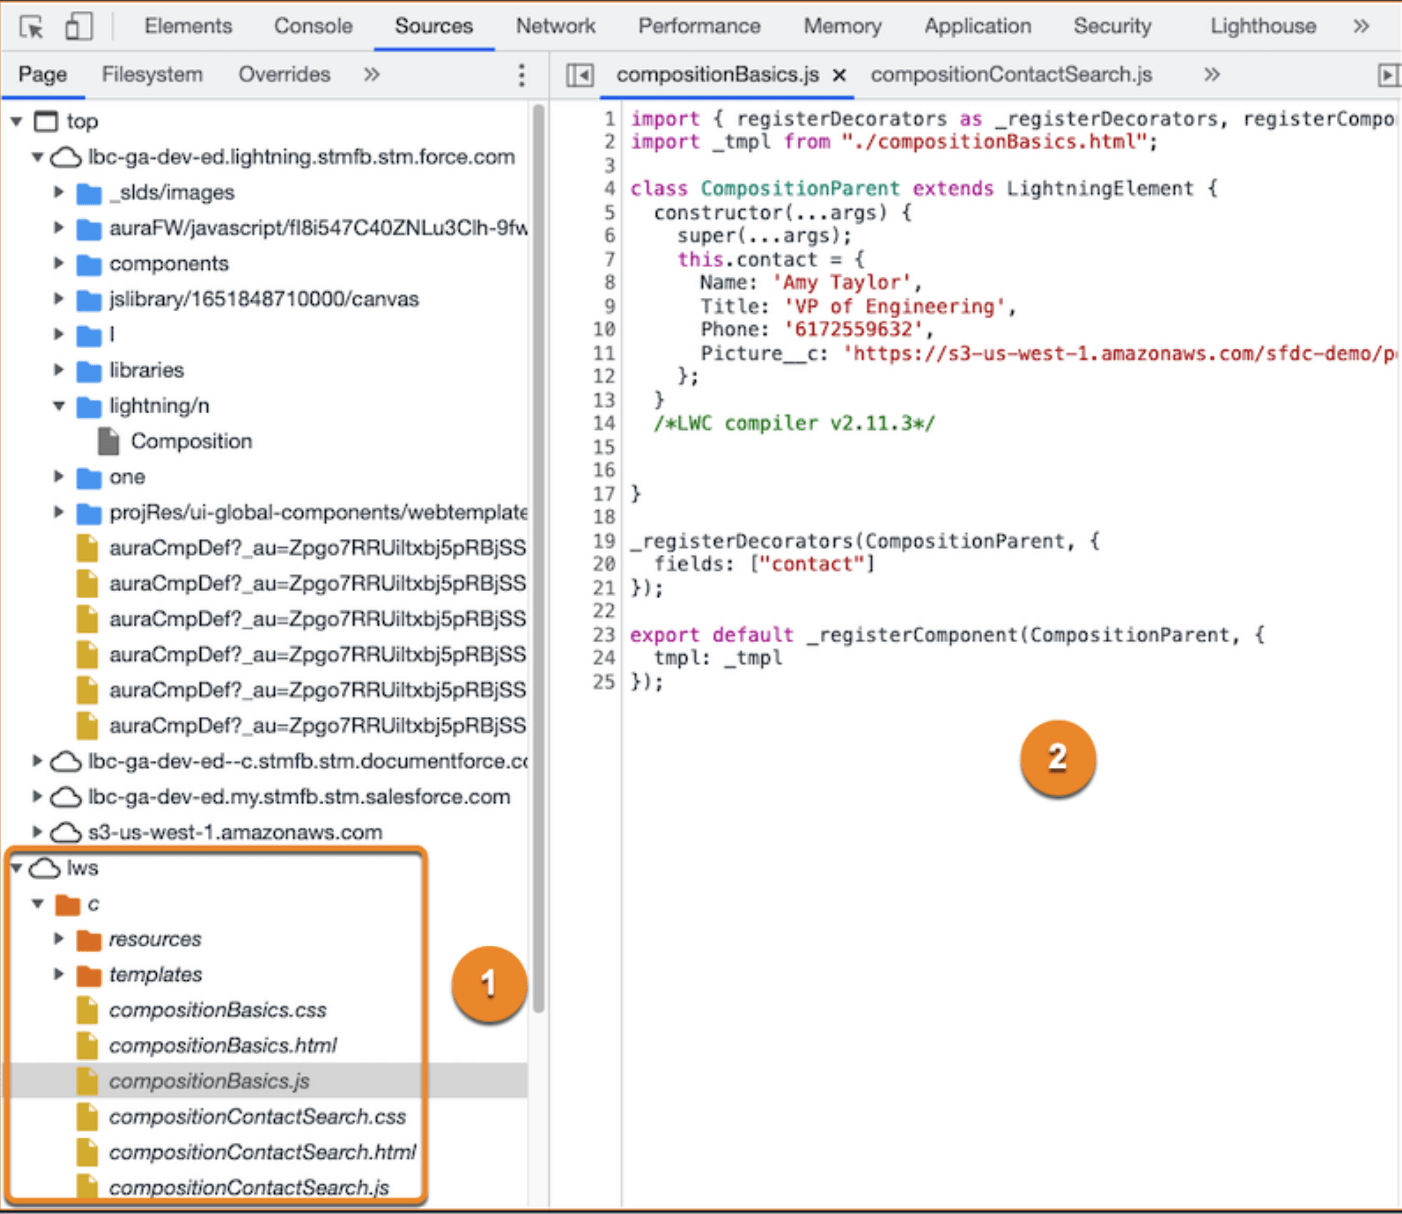
When your components run in an org where Lightning Web Security is enabled, look for the lws folder near the bottom of the Page pane. Expand the folder and see your component files organized under their namespace folder.
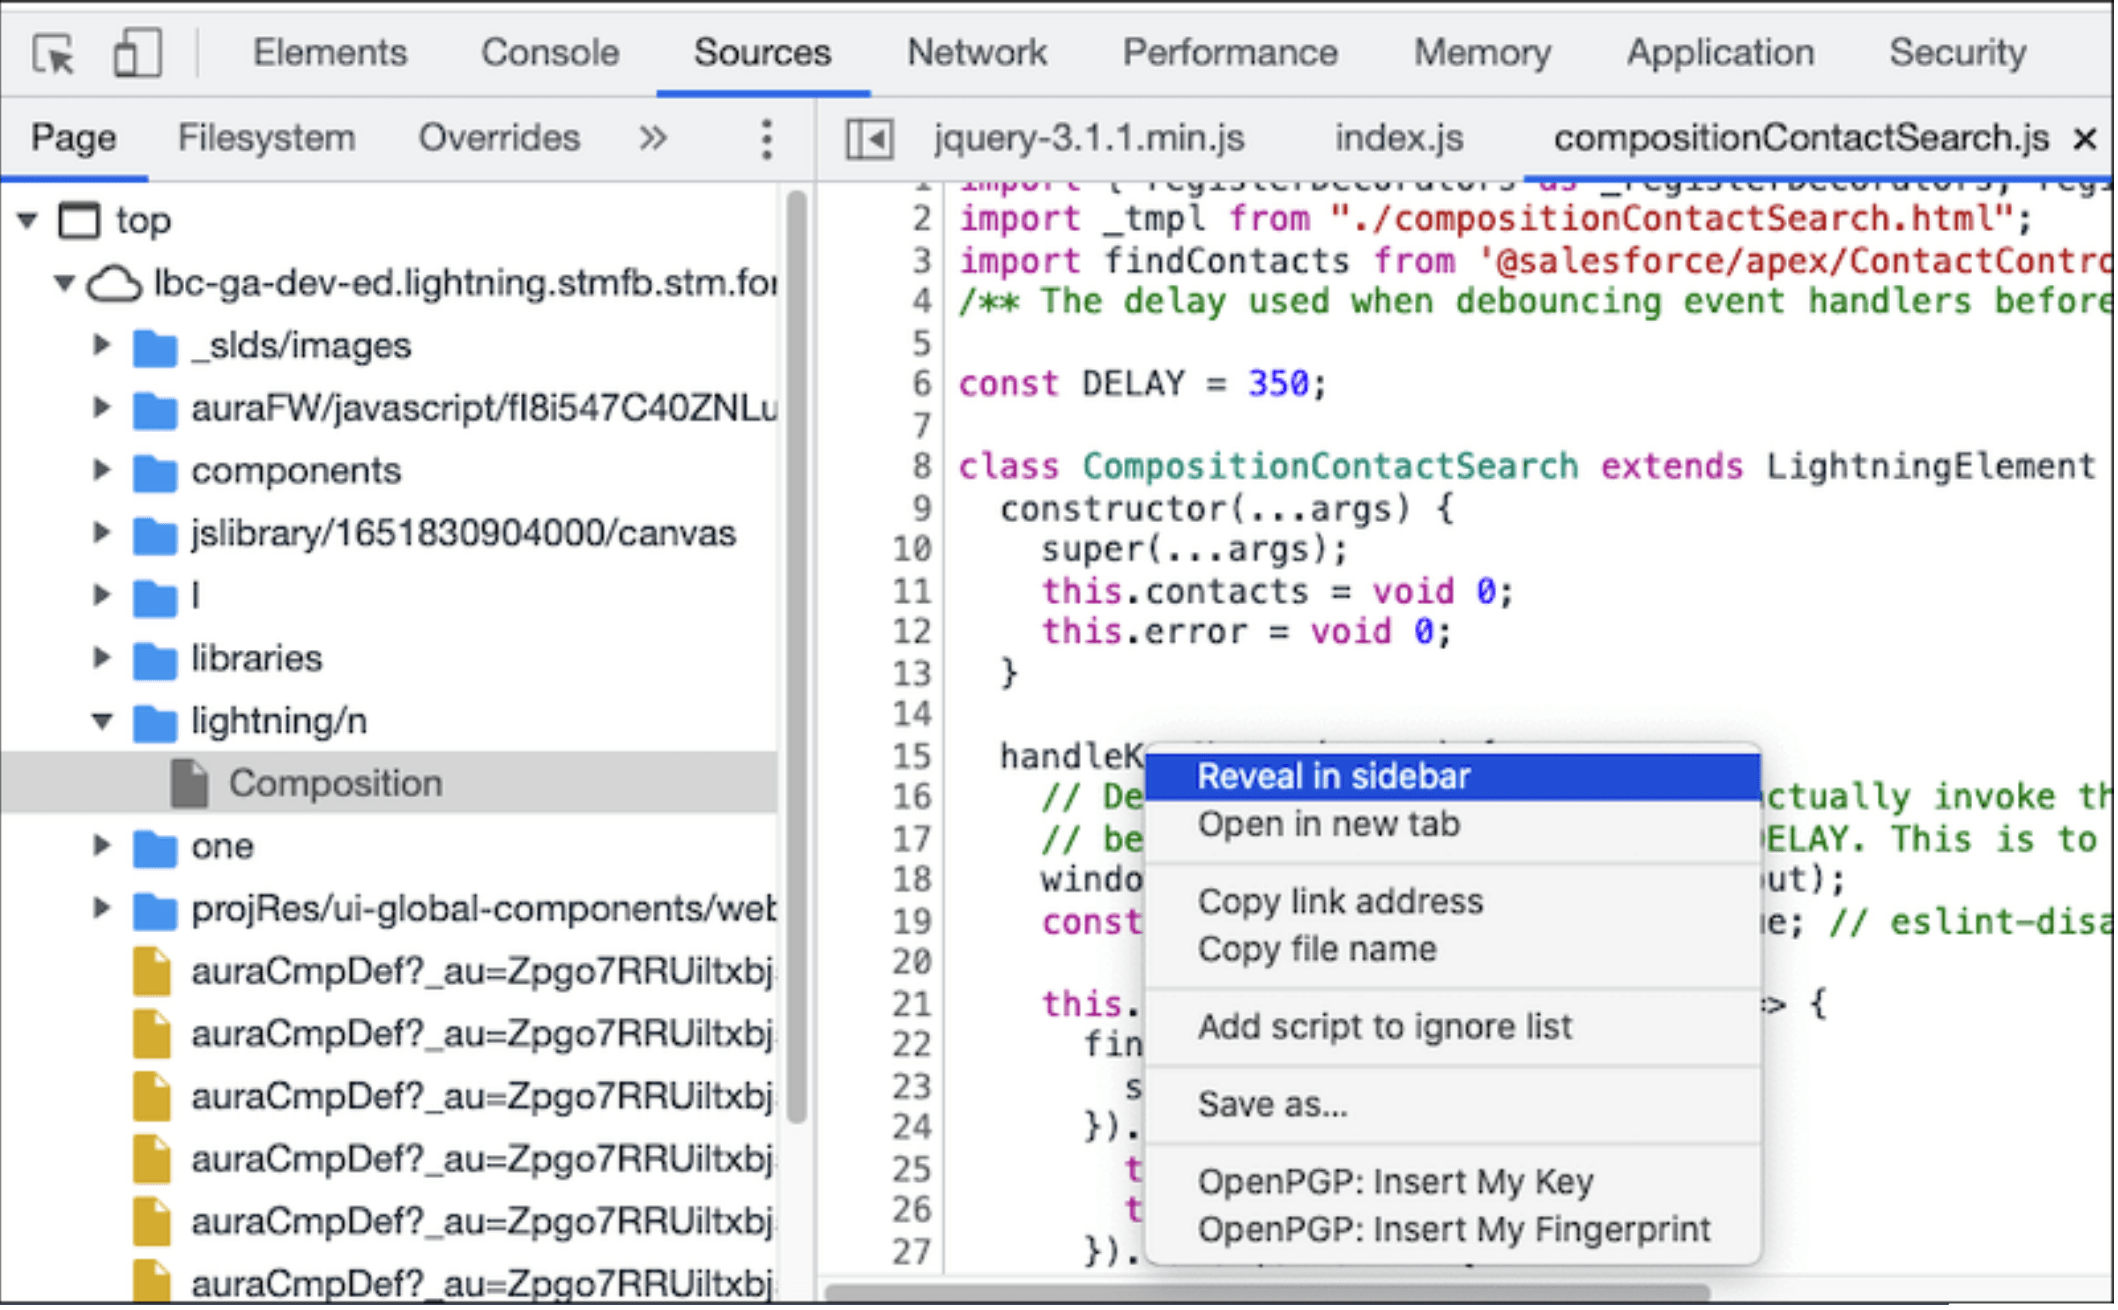
Here the debugger stopped in compositionContactSearch.js, but the file is not selected in the sidebar. When you select Reveal in sidebar, the correct file is selected in the lws folder.
Debug Lightning Web Components Video


Dear Amit,
I just wanted to take a moment to express my deep appreciation for your outstanding guide on debugging Lightning Web Components. Your expertise in this area is truly impressive, and your commitment to providing clear and concise explanations, as well as step-by-step instructions, is a testament to your dedication to helping others succeed in web development.
Your guide is an invaluable resource for developers who are looking to optimize the performance of their Lightning Web Components and ensure that they are delivering the best possible user experience to their audiences. Your practical tips and recommendations provide readers with a wealth of valuable insights and techniques to apply to their own projects, and your clear explanations make even the most complex concepts accessible and easy to understand.
I also want to commend you on your attention to detail and your willingness to provide practical examples and screenshots to illustrate each step of the debugging process. This makes it easy for readers to follow along and implement your recommendations with confidence, even if they are not experts in web development.
Overall, your guide is a true masterpiece of technical writing and a shining example of what can be achieved when expertise and passion are combined. Thank you for your invaluable contributions to the Lightning Web Components community, and for setting such a high standard of excellence in the field of web development.