Apex Execution has been one of the top performance bottlenecks for many Salesforce customers as it directly impacts App CPU. To help solve this problem, Salesforce partnered with Salesforce AI and developed a new feature called ApexGuru. Last week, we did one session with Karishma Lalwani called “Amplify your ALM with Scale Center and Apex Guru.” Let’s see what Apex Guru does.
What is Apex Guru?
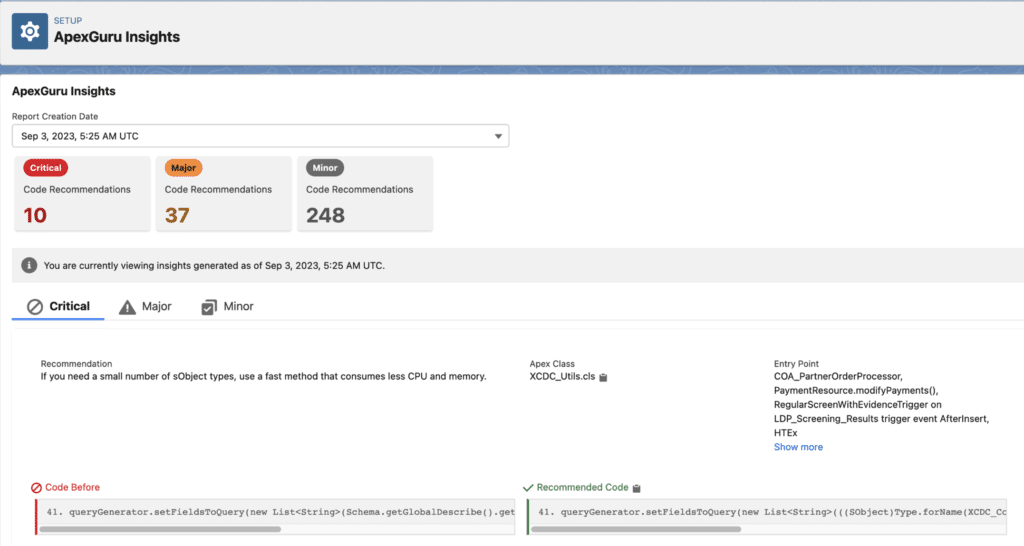
ApexGuru automates the detection of critical anti-patterns and performance hotspots in your apex code (runtime profiles) and provides customers with AI-driven insights and prescriptive code recommendations. It’s powered by Generative Artificial Intelligence (CodeT5 Model). Several of our Beta customers gave feedback that makes the recommendations and next steps as prescriptive and self-serve as possible.
Well, ApexGuru does precisely that. Pinpoint the exact class and line of code where the anti-pattern is detected, provide the recommended code fix, and prioritize these into critical, significant, and minor.
Feature of Apex Guru
- Code recommendations prioritize it as Critical, Major, and Minor based on the expected impact.
- Working SOQL’s antipatterns, slowest classes, hot methods
- Proactively improve code quality
- Promising Impact Metrics we have received so far.
- 20% overall AppCPU Savings.
- 80% AppCPU savings for top methods
Learn about Salesforce Apex Best practices.
How to access Apex Guru
To access the Apex Guru Insight you need to follow the below steps.
- Click on Setup then search for Scale center
- Under this scale center, you can find the ApexGuru Insight link.
- From there you can see Code Recommendation, SOQL/DML Analysis, Expensive Methods, Unused classes, and Methods tabs.

Summary
Apex Guru is a Pilot feature of the Salesforce scale center. Automates the detection of anti-patterns and hotspots (runtime profiles) and generates AI/ML-driven insights and recommendations.


Hi Amit,
Thank you for information on Apex guru feature on salesforce. I have few questions related to this topic if you could help me with the answers.
1. We need to select a report time to view the apex guru report. So the question is for feature of Unused classed and methods; the count showing is only specific to the report time selected (i.e. only one week data) or it is consolidated till the report time selected for the salesforce org?
2. Running the scale center analysis will add in the DB CPU consumption of the org and impact the org performance to some extent?
3. If you could also help me finding the comparison of Scale center tool with the autorabbit codescan tool (similarities and differences) would help me a lot.
Thanks.
Regards,
Suhaas