Reports in Salesforce give a clear picture to the management. With Salesforce reports, management can track progress toward its various goals to increase revenue and control expenditures. In this post, we will talk about Reports in Salesforce and different types of reports in Salesforce.
What is a Salesforce Report?
A Salesforce report is a list of data generated based on filter criteria. Salesforce Reports helped us predict trends and gave us the advantage of increasing profits. Admin can create reports quickly and can schedule the reports. Salesforce Dashboard or chart can be used to visualize and analyze your Salesforce report data.
Different Types of Reports in Salesforce
There are four types of reports in Salesforce. They are as follows:
1. Tabular report
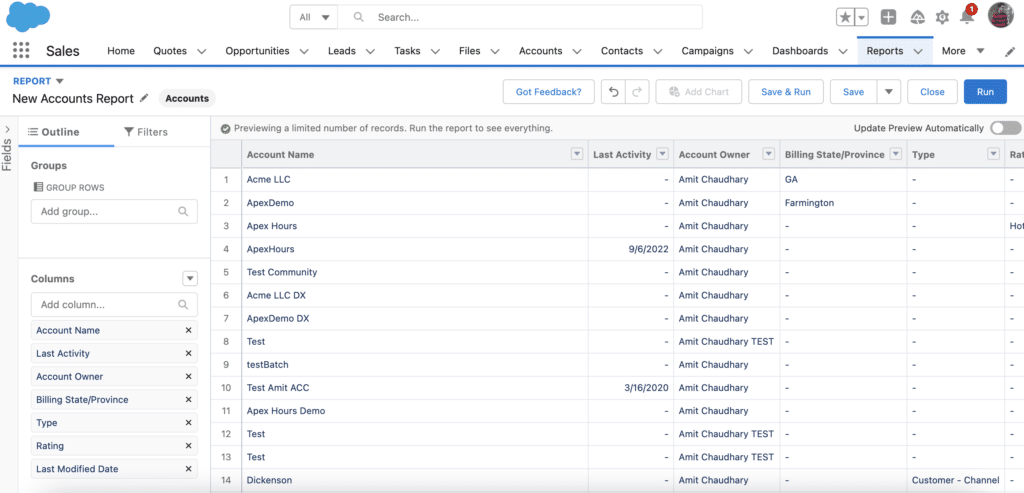
A report that provides details of a company in tabular format. It is used when you want a simple or item list with a total. These reports are used to list all accounts, list of opportunities, list of contacts, etc.
2. Summary report
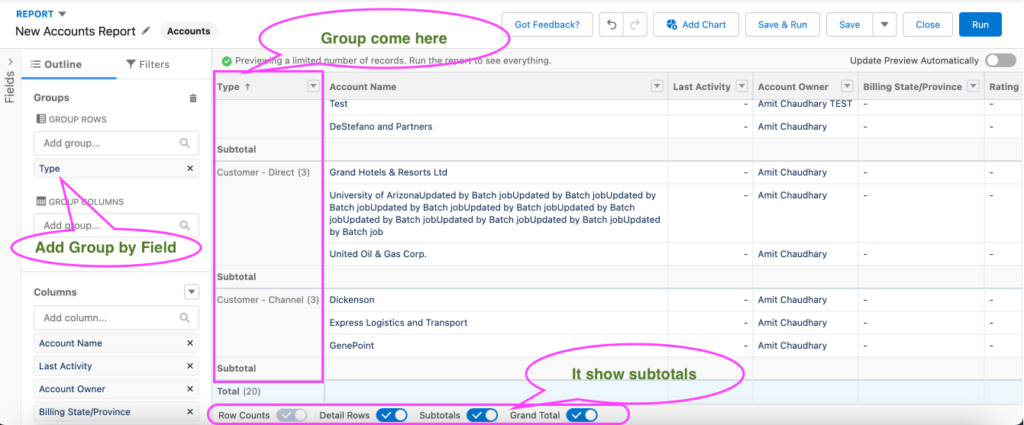
A report that provides a listing of data with groupings and subtotals. It is used when subtotals are needed, based on the value of a particular field, or when you want to create a hierarchically grouped report. For example, all opportunities for your team are subtotaled by owner and sales stage.
3. Matrix report
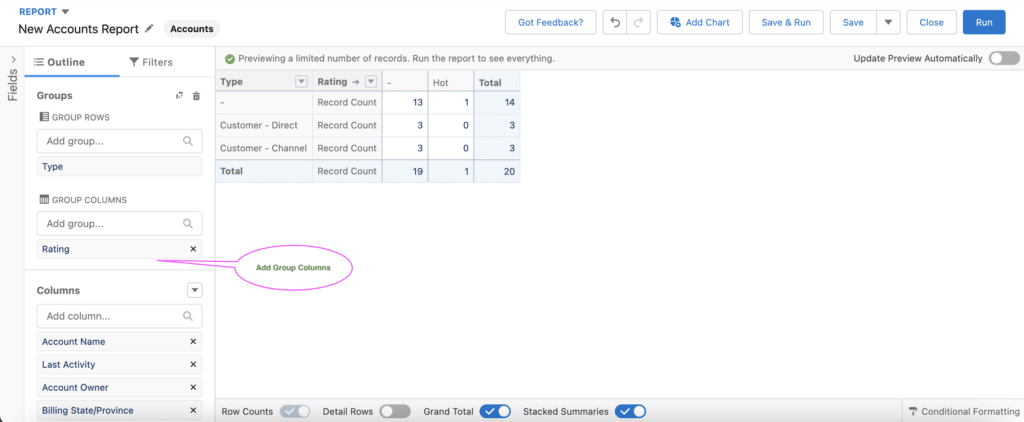
A report is formed by grouping the records by rows and columns. It is used when you want to see data by two separate dimensions that aren’t related, such as date and product. For example, Summarize opportunities by account horizontally and by month vertically.
4. Joined report
The mixture of any combination of reports creates a report. Like matrix report plus summary report can give you a joined report. Also, matrix reports and tabular reports can give a merged report. Example: You can develop a report to display your accounts’ opportunity, case, and activity data.
Learn more.
Custom Report Types
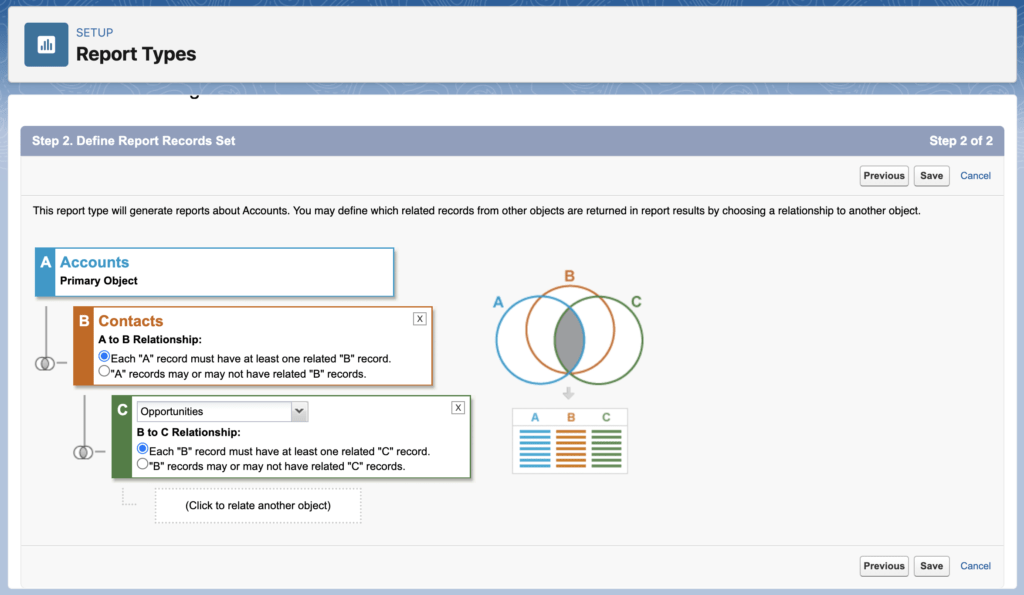
Report Types are templates that allow you to create Reports in different formats. Out of the box, Salesforce provides a set of predefined standard report types. Don’t see all the fields you want? You might need to create a custom report type. A report is a list of records that meet your criteria. It’s displayed in Salesforce in rows and columns and can be filtered, grouped, or displayed in a graphical chart.
With the help of a report, you can show the key information about the objects—for Example, Top Accounts, Top Products, and Successful Marketing campaigns.
How To Create A Report in Salesforce
Let’s see how we can create the report in Salesforce. Let get started
- Click on the “Report” tab
- Then select the “New report” button

- Select the object on which you want to create the report. Then click on the Start Report button.
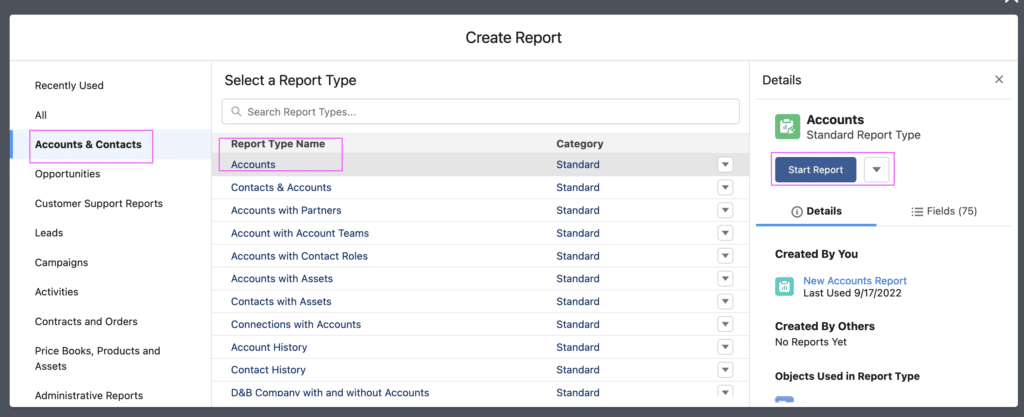
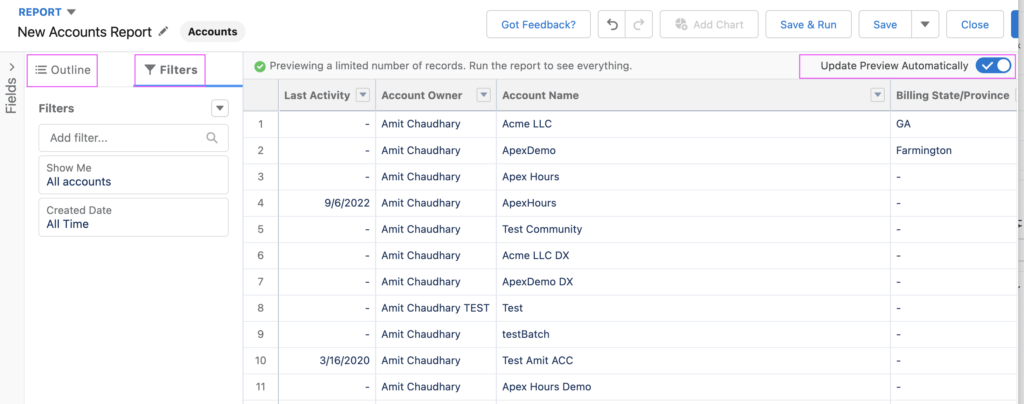
- Once you click on start report, the below canvas will open.
- Outline: You can drag and drop a field from here
- Filter: You can add a filter from the Filter tab
- Update Preview Automatically: Turn this one to see an update on the report without a refresh.
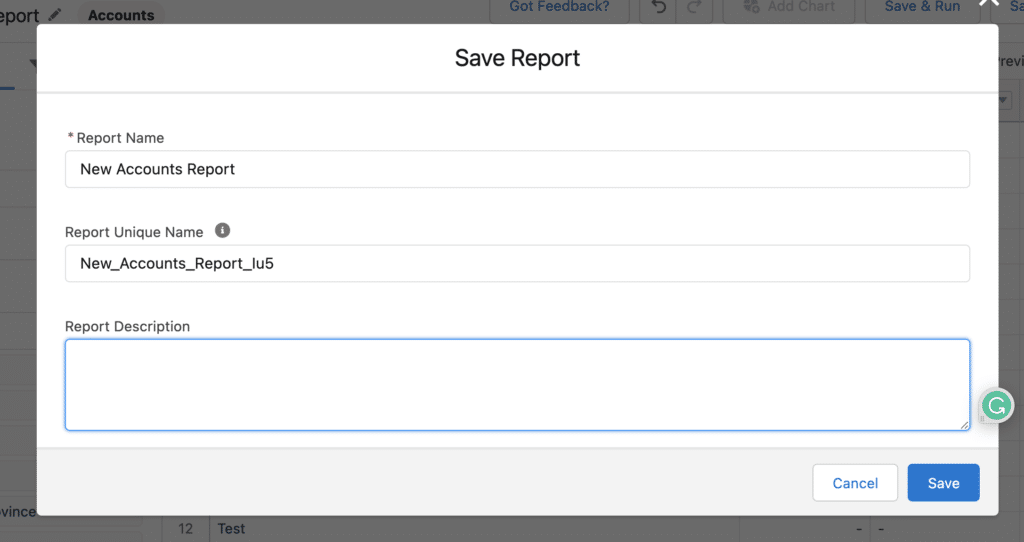
- Click on the Save button to save the report and provide the Report name and unique name.
Use Group Rows to create the summary field.
Scheduling a Salesforce Report
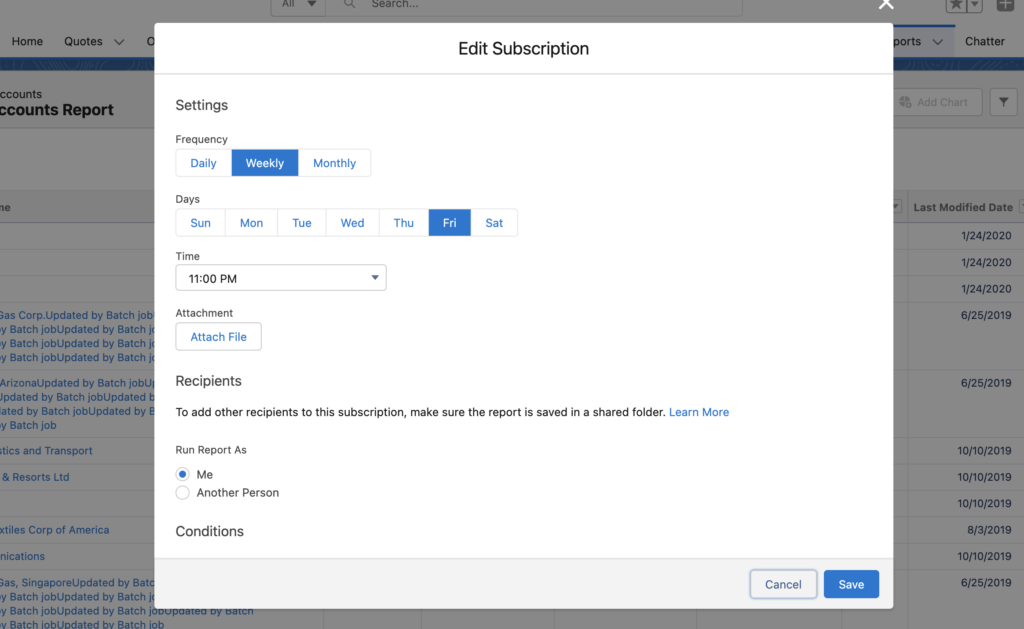
In Lightning Experience, we can subscribe to up to 5 reports. Users must access the folder to subscribe to a report. We can receive the emailed report daily, weekly, or monthly like the below screen.
URL-Based Filter in Reports
URL-based filters are used to filter based on some dynamic values. For Example, displaying the list of all the contact records related to a single Account
Summary
I hope the above recording will help you to understand what reports are in Salesforce and how to create reports in Salesforce.


