Heap size issues in Apex don’t come from careless coding. They come from perfectly reasonable code running against real data. A few thousand records, a couple of long text fields, or one oversized API payload is enough to push a transaction over the limit.
Salesforce allows 6 MB of heap for synchronous Apex and 12 MB for asynchronous Apex, measured per transaction, and exceeding it immediately fails execution.
This article explains Apex heap management in a practical way, using examples that mirror what actually breaks in production.
What is the Apex Heap ?
The Apex heap is the runtime memory Salesforce allocates for a single transaction. Every object that exists in memory during execution contributes to heap usage. This includes queried records, collections, wrapper objects, strings, and serialized JSON.
A trigger queries 500 Accounts and stores them in a list. Each Account has a rich text field used for internal notes. Even if your logic never touches that field, Salesforce still loads it into memory. Multiply that by hundreds of records and heap usage spikes instantly.
This is why heap issues often appear only after deployment, when production data is larger and messier than sandbox data.
Heap Size Limits and Why Async Still Fails
Salesforce enforces strict heap limits per transaction. Synchronous Apex gets less memory, while asynchronous Apex gets more. Many developers assume async means “safe,” but that’s rarely true.
A Queueable job receives a List<Opportunity> from a trigger. The list contains hundreds of records, each with multiple large text fields. Before the job even starts executing, Salesforce serializes that list. Heap usage spikes during serialization itself, and the job fails before any logic runs.
How SOQL Design Directly Affects Heap
Heap issues often start at the query level. Querying unnecessary fields silently increases memory consumption.
A controller queries Cases for a Lightning page:
SELECT Id, Subject, Description, Internal_Notes__c, Resolution_Details__c FROM Case
The page only displays Subject. The other fields exist only because “we might need them later.” In production, Internal_Notes__c contains large historical text. The page works for a few records but crashes when a user opens a list view with hundreds of cases.
Query only the fields used by the UI. Re-query later if needed. Heap saved, problem gone.
Collections and Maps:
Lists and Maps are essential in Apex, but storing full SObjects inside them is costly.
A trigger builds a map of Accounts for quick access:
Map<Id, Account> accountMap = new Map<Id, Account>(accounts);
Later logic only needs the Account name. The map still holds full Account objects, including unused fields and child relationships.
The best approach is store only what you actually need:
Map<Id, String> accountNameMap = new Map<Id, String>();
This single change can reduce heap usage by several megabytes in large transactions.
Wrapper Classes That Quietly Blow Up Heap
Wrappers are a common source of heap problems because they hide memory growth behind clean-looking code.
An LWC controller builds a wrapper per Opportunity that includes:
- Full Opportunity record
- Related Account record
- A list of recent Activities
This works fine in testing. In production, users open an Opportunity list with 200 records, and the controller tries to build 200 heavy wrapper objects. Heap limit exceeded.
The best approach is Refactor wrappers to store primitives and IDs instead of full records. If detailed data is needed, load it lazily or on demand.
Static Variables and Trigger Side Effects
Static variables persist for the entire transaction. In trigger-heavy flows, this matters a lot.
A static list is used to prevent recursion in a trigger. Over time, developers add more data into that static list “temporarily.” In a single transaction involving inserts and updates, the static list keeps growing across trigger contexts.
Eventually, heap usage crosses the limit without any obvious loop or query problem. Use static variables for flags, not data. If you must store data, clear it explicitly.
JSON Serialization: Double Memory, Same Data
An integration serializes a full Lead record:
String payload = JSON.serialize(leadRecord);
Now heap holds:
- The Lead SObject
- The serialized JSON string
If the Lead has large description fields or nested data, heap usage doubles instantly.
The better approach is Create a lightweight DTO containing only required fields and serialize that instead
A lightweight DTO is a simple Apex class used only to transfer required data. It avoids SObjects and heavy structures, uses primitives, and keeps payloads small to reduce heap usage and improve performance.
Let’s say you’re sending Lead data to an external system.
Lead l = [SELECT Id, FirstName, LastName, Email, Company, Description FROM Lead WHERE Id = :leadId];
String payload = JSON.serialize(l);
What actually gets serialized:
- Full Lead object structure
- Salesforce-specific metadata
- Fields you don’t really need
- Large text fields like Description
Heap usage increases fast, especially in bulk or async jobs.
Create a separate class that represents only what the external system needs.
public class LeadDTO {
    public String firstName;
    public String lastName;
    public String email;
    public String company;
}

Lead l = [ SELECT FirstName, LastName, Email, Company FROM Lead WHERE Id = :leadId ];
LeadDTO dto = new LeadDTO();
dto.firstName = l.FirstName;
dto.lastName  = l.LastName;
dto.email     = l.Email;
dto.company   = l.Company;
String payload = JSON.serialize(dto);
Now your payload contains only four strings. That’s what makes it lightweight.
Releasing Memory During Execution:
Apex garbage collection is automatic, but you can help it.
A batch processes a large list of records and then performs a callout. The list remains in memory even after processing.
Clearing references after use:
records.clear();
records = null;
This allows Salesforce to reclaim memory earlier in the transaction and often prevents heap overflow near the end.
Debugging Heap Issues the Right Way
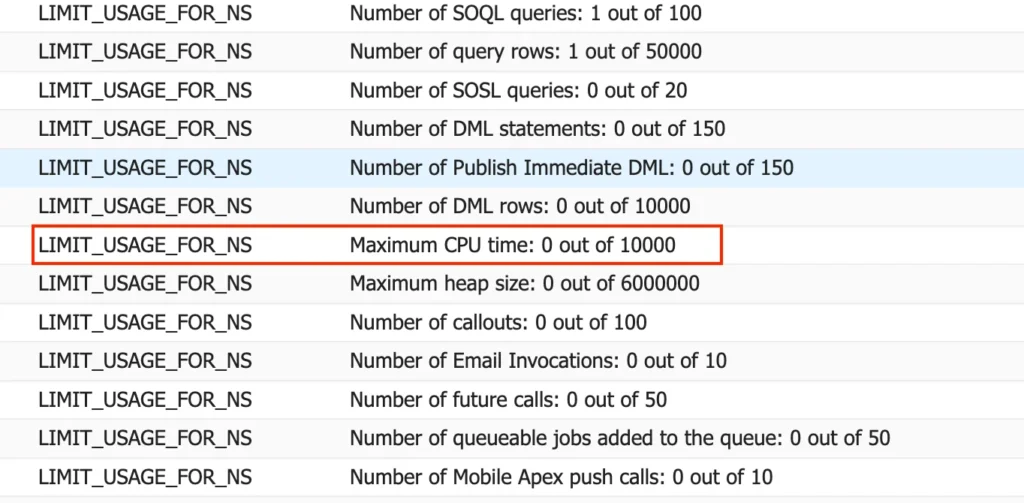
When heap errors occur, guessing doesn’t help. Measurement does. Add heap checkpoints:
System.debug(‘Heap after query: ‘ + Limits.getHeapSize());
By logging heap size after each major step, you can pinpoint exactly where memory spikes and fix the real cause instead of rewriting everything.
Final Thoughts
Apex heap limits are not a nuisance. They are guardrails that force better design.
When your code:
- Queries only what it needs
- Stores minimal data in memory
- Passes lightweight payloads to async jobs
- Releases references early
It scales naturally and survives production data. Thanks for Reading and Happy Coding.