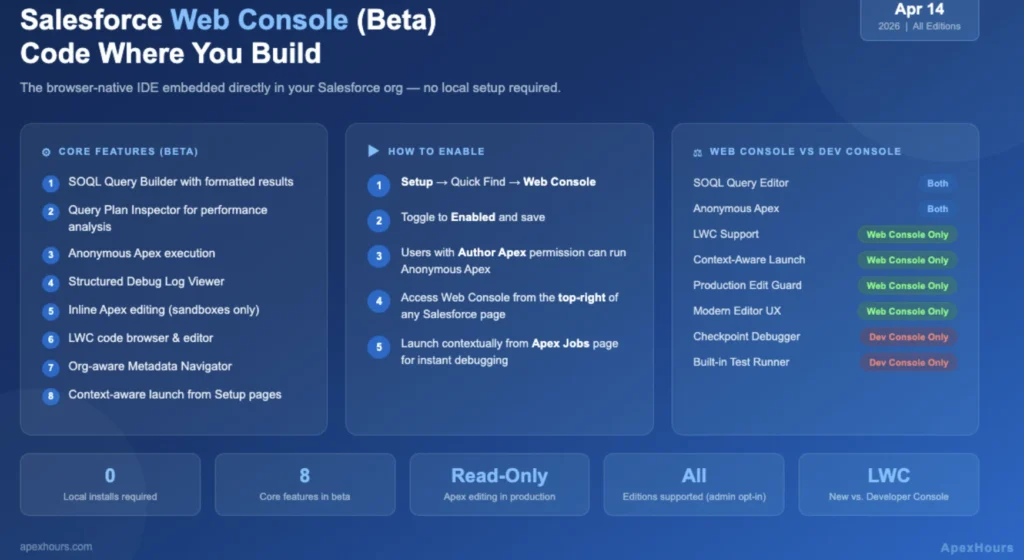
Salesforce has introduced Web Console, now in beta starting April 14, 2026. It’s a browser-based IDE embedded directly inside Salesforce — debug logs, SOQL execution, Anonymous Apex, Query Plan analysis, and inline code editing, all available without leaving the platform you’re already working in.
This guide walks you through what Web Console is, how to enable it, how to use its core features step by step, and where it fits in your real-world developer workflows. Whether you’re an admin who dabbles in Apex or a full-stack developer tired of tool sprawl, Web Console is worth understanding now.
What is Web Console?
Web Console is a modern, lightweight, browser-based IDE designed to bridge the gap between outdated legacy tools and high-overhead development environments. It serves as a solution for the Salesforce ecosystem by addressing three specific pain points. Web Console provides in-context tasks, such as writing Apex or querying Salesforce Object Query Language (SOQL) directly within the org.
- Development efficiency and tool consolidation
- Replacing legacy tools: Web Console provides a modern alternative to the aging Developer Console and the officially unsupported Workbench.
- Universal accessibility: Unlike the full-fledged Agentforce Vibes IDE, which is available only in paid orgs, Web Console is available in all orgs.
- No local setup required — runs entirely in your browser, authenticated with your existing Salesforce session
- Context-aware entry points — launch it from relevant Setup pages (like Apex Jobs) so the relevant code is already in focus.
- LWC support — review and edit Lightning Web Components, something Developer Console never supported.
- Security model inheritance — your permissions in the UI are your permissions in Web Console; no privilege escalation.
Why Web Console
The Developer Console has been the in-browser development tool of choice in Salesforce for over a decade. It served its purpose, but it has aged. It doesn’t support Lightning Web Components. Salesforce developers have largely migrated to VS Code with the Salesforce Extension Pack for serious work — but that requires local tooling, CLI setup, and authentication flows that aren’t practical for quick investigative tasks.
Web Console was designed around that insight. According to Raj Sensharma, Director of Product Management at Salesforce who authored the official launch post, the goal is explicit: “developers should not have to leave Salesforce to build Salesforce apps.”
What’s in the Beta (April 14, 2026)
| Feature | Description |
|---|---|
| Debug Log Viewer | Dedicated interface to capture, filter, and inspect Apex execution logs |
| SOQL Query Builder | Execute SOQL queries with formatted result display |
| Query Plan Inspector | Analyze query performance and index usage |
| Anonymous Apex Execution | Run ad-hoc Apex code without creating a class |
| Inline Apex Editing | View and edit Apex classes and triggers in-context |
| Visualforce Page Access | Browse and edit Visualforce pages |
| LWC Code Viewer | Review Lightning Web Component source (JS, HTML, CSS) |
| Org-Aware Metadata Navigation | Navigate your org’s metadata without switching tools |
Setup Web Console IDE (Step by Step)
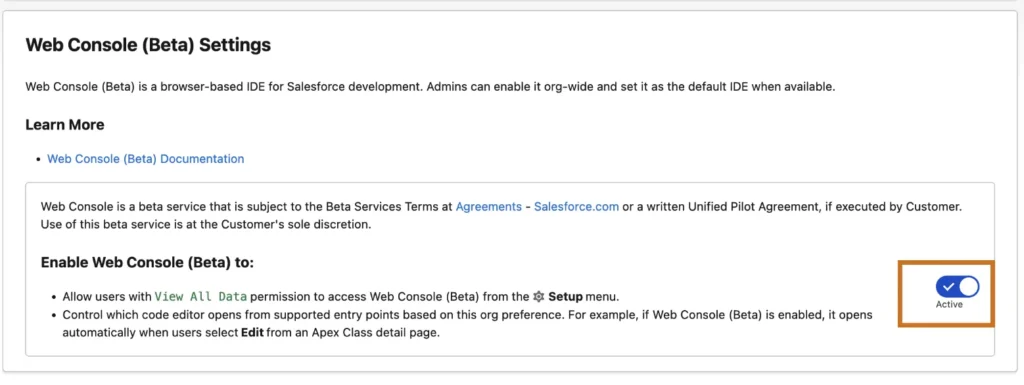
Web Console ships off by default. An org admin must activate it through Setup before anyone can use it.
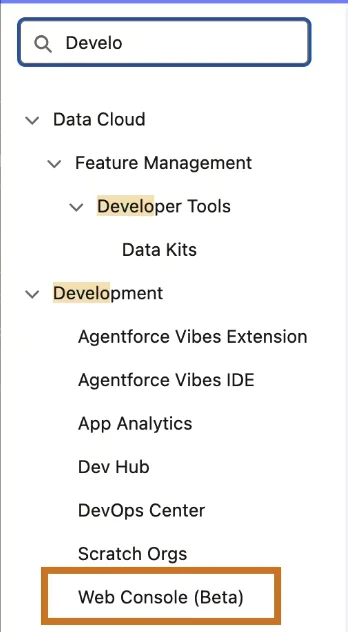
1. Enable Web Console IDE
- From the Setup search Web Console (Beta).
- Enable Web Console (Beta) to button to Active
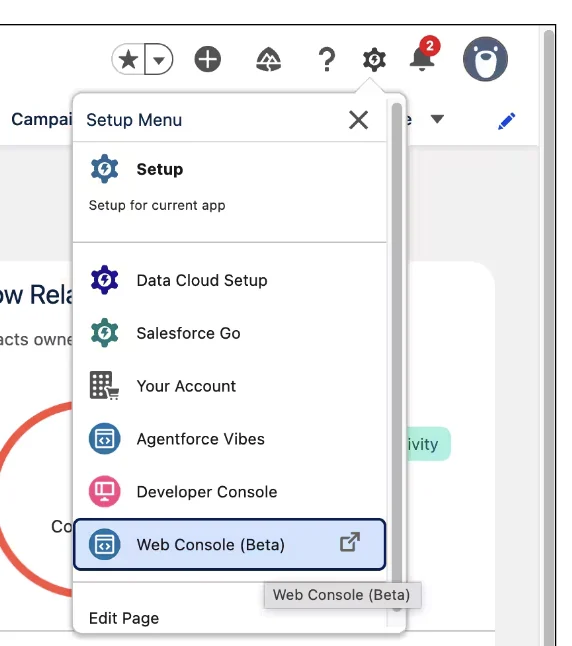
2. Launch the IDE
Once enabled, Web Console is accessible from the top-right corner of the Salesforce interface. You can also launch it contextually from relevant Setup pages such as the Apex Jobs queue — the flagship use case for the context-aware design.
Core Feature Walkthrough
Running SOQL Queries
- Open Web Console from your Salesforce org
- Navigate to the SOQL Editor in the right panel
- Write your query and click Execute
- Results appear in the bottom panel as a formatted table
- To inspect query performance, switch to the Query Plan tab before executing
Executing Anonymous Apex
Anonymous Apex is the fastest way to test a logic snippet, bulk-update records during a migration, or investigate a method’s behavior with real org data.
- Navigate to the Anonymous Apex tab in Web Console
- Write your Apex code
- Click Execute
- Switch to the Debug Log panel to see your
System.debugoutput and full execution trace
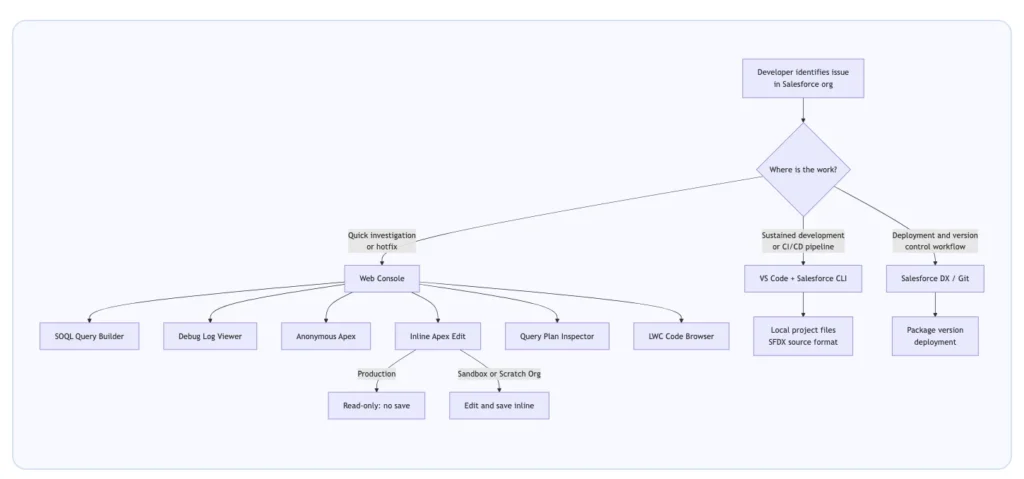
How Web Console Fits in the Developer Toolchain
Web Console vs. Developer Console: What Changes
| Capability | Developer Console | Web Console (Beta) |
|---|---|---|
| Anonymous Apex | Yes | Yes |
| SOQL Query Editor | Yes | Yes |
| Query Plan Inspector | Yes (buried in Query Editor) | Yes (dedicated tab) |
| Debug Log Viewer | Yes (raw text + basic filters) | Yes (structured hierarchy) |
| Apex Class Browser | Yes | Yes |
| Apex Trigger Browser | Yes | Yes |
| Visualforce Page Support | Yes | Yes |
| LWC Support | No | Yes |
| Context-Aware Launch | No (always starts fresh) | Yes (from Apex Jobs etc.) |
| Production Edit Guardrail | No (can edit in production) | Yes (read-only in production) |
| Modern Editor UX | No (CodeMirror-era UI) | Yes |
| Test Runner | Yes | Not in beta |
| Checkpoint Debugger | Yes | Not in beta |
Reference